Introduction
Muyu (木鱼) is a simple keypress counter that lives in your menu bar.
Features
-
Privacy first, stores all data on-device, delete anytime. All in your control
-
Aesthetic menu bar item, ultra-lightweight
-
Simple graphing of keypress distributions using matplotlib
Development Process
Keypress monitoring
I first used the keyboard module in Python to catch keypresses; it requires a while True loop for it to constantly listen to keyboard presses. This is not ideal since I would need to have multiple threads running on endless loops for both the keyboard monitoring and the menubar rendering using rumps .
I switched to using the pynput module for keyboard input presses because it offers a Listener A class that handles keyboard events asynchronously, which is useful for not needing to write an infinite loop, and is easy to integrate with rumps - which is heavily event-driven.
1def on_press(key):
2	# Update database ...
3
4def init():
5    # ...
6    listener = Listener(on_press=on_press)
7    listener.start()
8    return listener
Data management
To save keypress data between app restarts, I need to store it in persistent file storage rather than variables, which get cleared when the process is killed. I did this by storing all the data within a JSON database and parse this into a Python dictionary via the json module.
This JSON database is structured like this:
1{
2    "total": 2497,
3    "a": 86,
4    "b": 52,
5    "c": 30,
6    "d": 47,
7    "e": 147,
8    "f": 19,
9	// ...
10}
Writing the keyboard presses directly to the JSON file every time a key is pressed would lead to a high IO, which would cause a higher CPU usage than necessary; instead, I chose to update the Python dictionary type variable db_parsed with the new value, and only dump this as JSON format to the file every 10 seconds (done via starting a separate thread for saveDB function).
1def saveDB():
2    print("DEBUG")
3    while True:
4        time.sleep(10)
5        with lock:
6            with open(db_path, 'w') as db:
7                    # db_parsed is the Python dict of the keypresses data
8                    json.dump(db_parsed, db)
9        print("Saved!")
10# ...
11
12def init():
13    threading.Thread(target=saveDB, daemon=True).start()
Menubar Item
This part is quite easy in comparison; I just had to call the backend.init() function when initialising the Rumps application, and periodically fetch the new counter data via backend.getDB() function, then pass the total count to the renderer that updates the counter displayed in the menubar.
1class muyuApp (rumps.App):
2    def __init__ (self, name="muyu", title=f"⌨️ {counterNumber}", # ...)
3        super().__init__(name, title, # ...)
4        self.total = -1
5	   # Initialize the backend (keyboard counter)
6        backend.init()
7
8	# Get the new counter data from the backend
9    @rumps.timer(0.1)
10    def updateCounter(self, _):
11            parsed_db = backend.getDB()
12            self.total = parsed_db["total"]
13            self.updateCounterUi(self)
14
15	# Show the new count in the menu bar (title)
16    def updateCounterUi(self, _):
17        parsedTitle = "⌨️ " + str(self.total)
18        self.title = parsedTitle
Plotting Keypresses
I thought it would be quite interesting to plot a distribution of keypresses on a bar chart, showing which keys were pressed the most. Data plotting is done inside graph.py using the matplotlib library. I ignored the click values for modifier keys (e.g. ⌘, ^) and the total amount in the graph by not including any data containing Key. their identifier and excluding the total field.
1def plotKeyboard(db):
2    x_axis = []
3    y_axis = []
4    for _, key in enumerate(db):
5        # Ignore "total" and special keys
6        if key == "total":
7            pass
8        elif "Key" in key:
9            pass
10	   # Including all other keys
11        else:
12            x_axis.append(key)
13            y_axis.append(db[key])
Interesting Finds
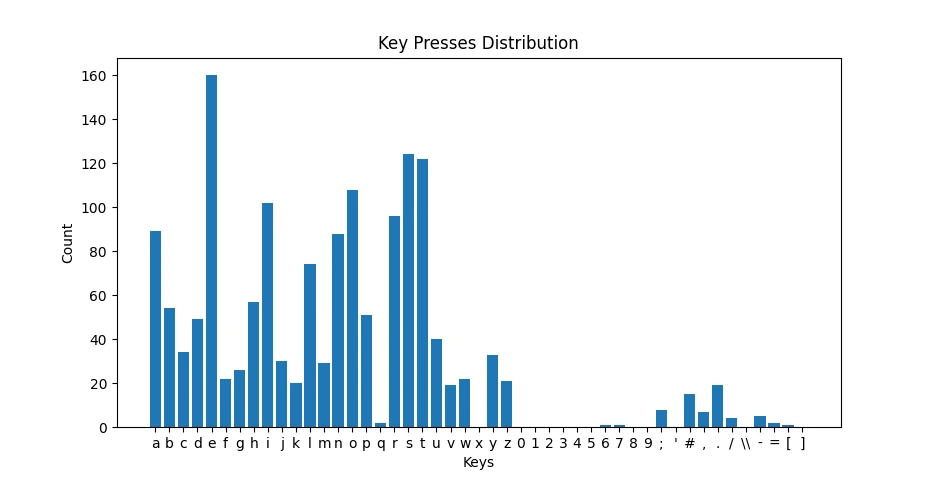
The tool generated an Interesting graph based on keypresses across 3700 presses (Fig. 1) that demonstrates a strong correlation with the frequency of English letters in dictionaries (Fig. 2).
Fig. 1 Graph generated across 3700 keypresses after typing this project post (Only including English characters)
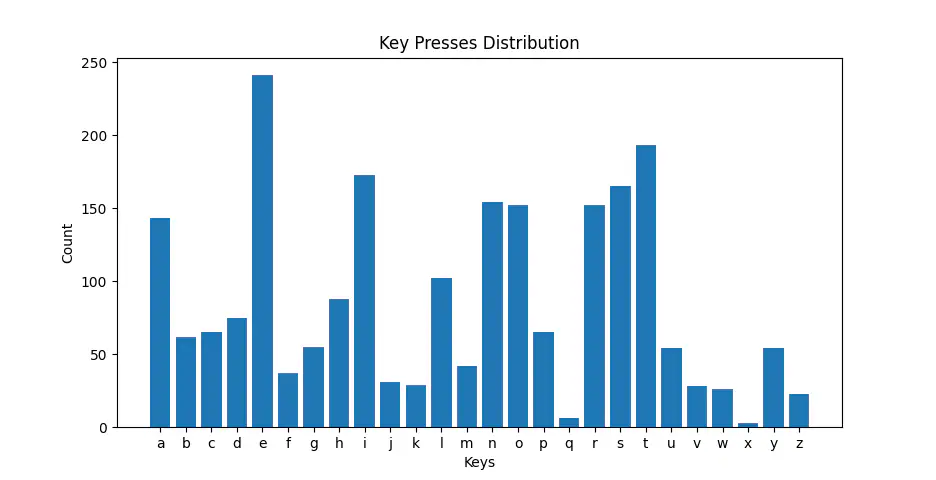
Fig. 2 English letter frequency in a dictionary
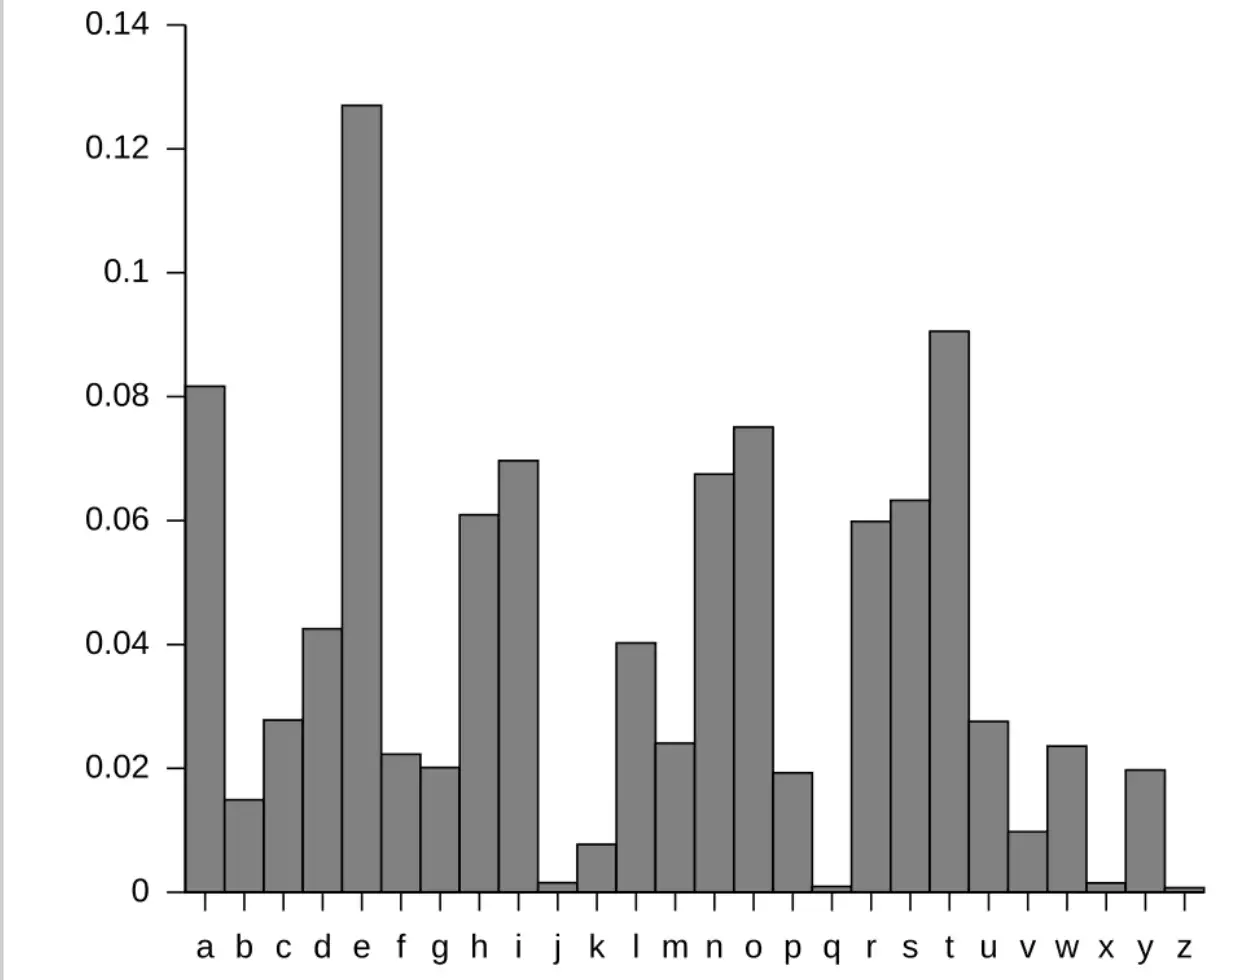
Credit: Wiki-Commons
Wrap Up
Overall, making this was interesting. I learnt how to use pynput to handle system-wide keypresses, how to make a simple menubar application using rumps and also basic graphing using matplotlib .
Hmm, why is the letter 'e' used so much in English...
As always, the source code of this project is open source on GitHub. (P.S. Leave a star if you found it interesting. Thanks!)